My current research project is aimed at locating the residence of 6500+ inhabitants listed in the 1940 census of Albemarle County. This work will be presented at the Virginia Forum in March 2014 and I am hoping that discussions of mapping techniques and relevant historical issues at ThatCamp can guide me in completing a project that will have technical and historical merit.
There will be a dot on the map for each person that will display their 1940 census record when clicked. I plan to group residents into four classes: white land owners, black land owners, white renters, and black renters. I want to represent this information with semi-transparent spatial density layers created from the dots for each grouping, which ought to allow the viewer to intuitively perceive the spatial relationship between each group and a base layer of land ownership by race.
The geodatabase will contain all significant census data for each individual. This will allow map users to explore the relationships betwe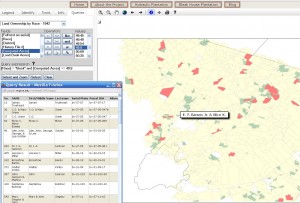 en categories of census data and land ownership by way of Boolean queries. For example, it might be interesting to look at the relationship between race, level of education, and acres owned. The query results can be exported to a spreadsheet for analysis and will be displayed as selections on the map (see map image and use Firefox to view interactive map at people.virginia.edu/~rwv6ad/CVHR/map1/ ). At this stage the goal of this project is not to answer questions about racial segregation in a rural setting, but to provide data and tools to begin to formulate interesting and relevant questions that may emerge from viewing data in a spatial context.
From a broader historical perspective, I have been interested in the formation of rural African-American communities after the Civil War from the enslaved communities that existed on farms and plantations. How did freedmen acquire land and what was the quality of the land they purchased? When, how and where were black churches and schools established? These are the institutions that formalized the identities of rural African-American communities. When and how were the names of these communities incorporated into land and tax records? — in essence, recognized as distinct entities by white county administrators.
My guiding concept in this research is that segregation implies not only social, but physical separation. Therefore, it seems that spatial mappings of race and residence must be a foundational tool for studying themes like the one proposed for the upcoming Virginia Forum, “the creation, maintenance, or transgression of racial boundaries.”


